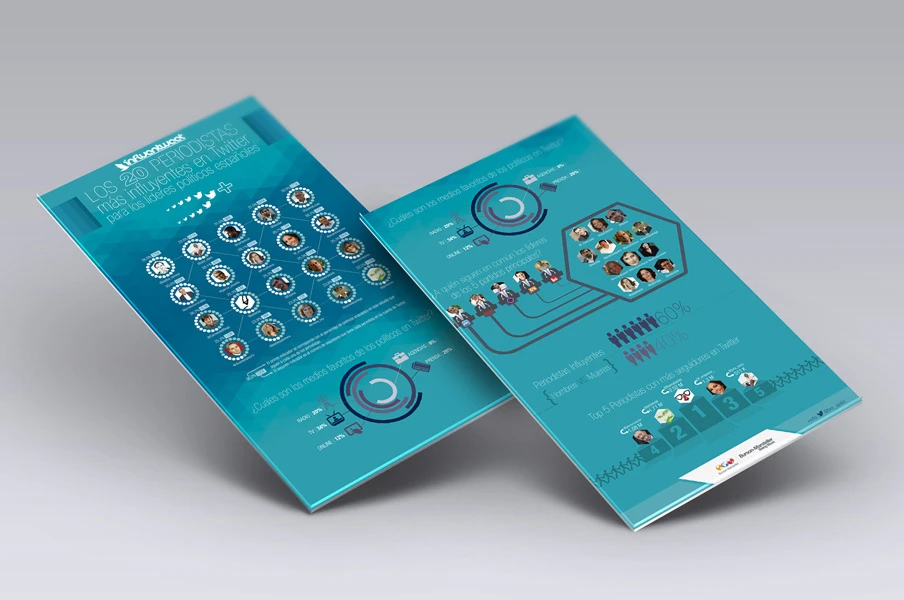
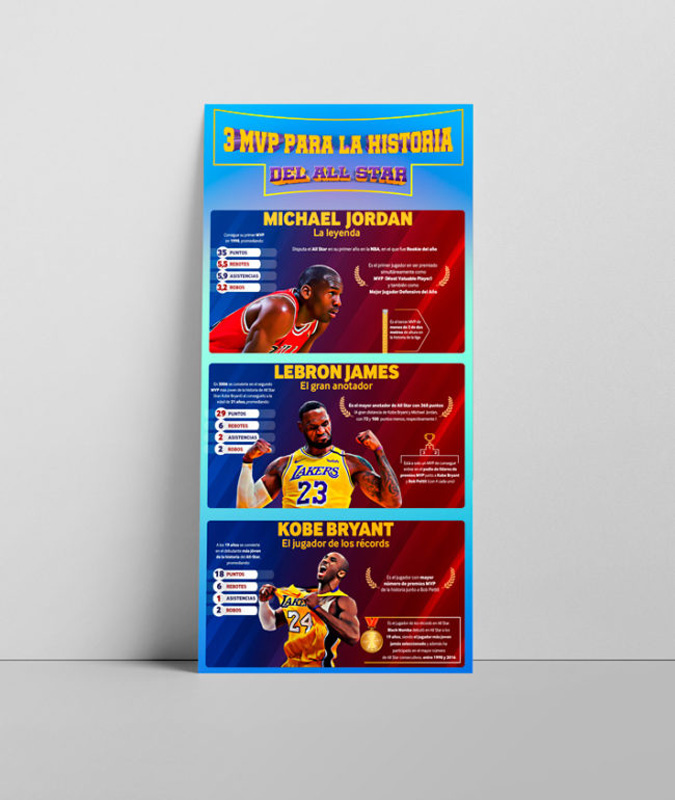
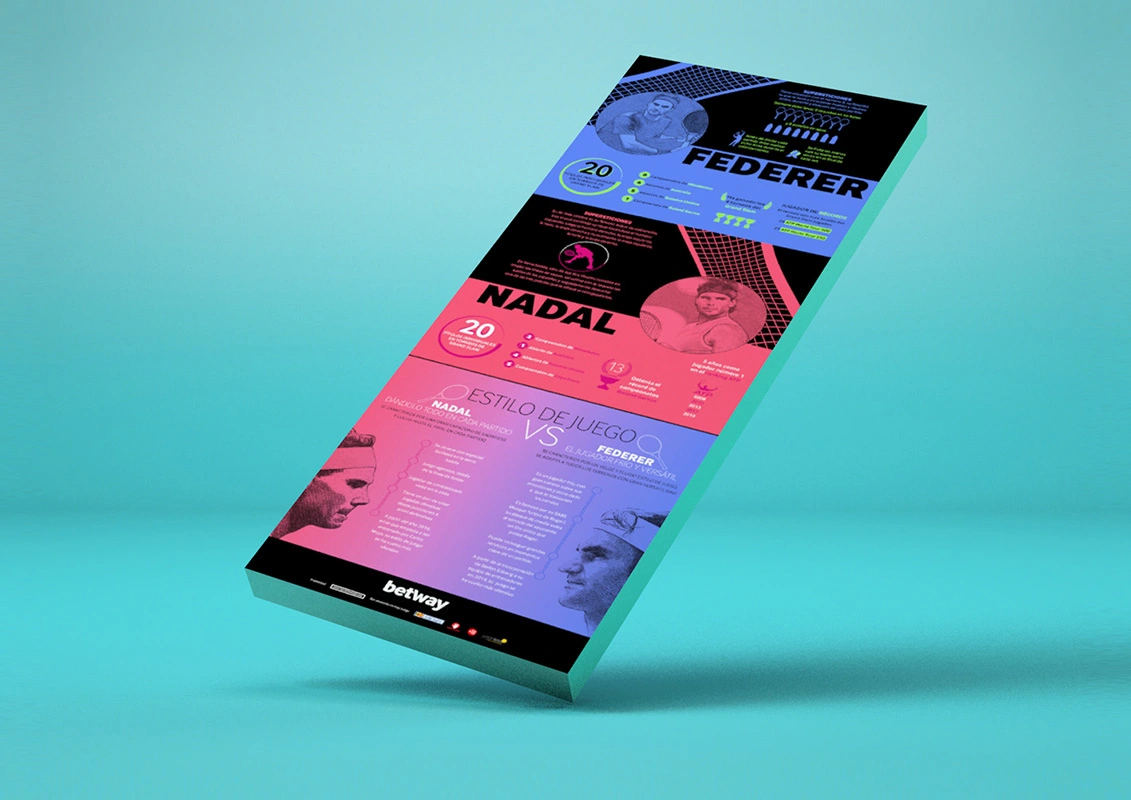
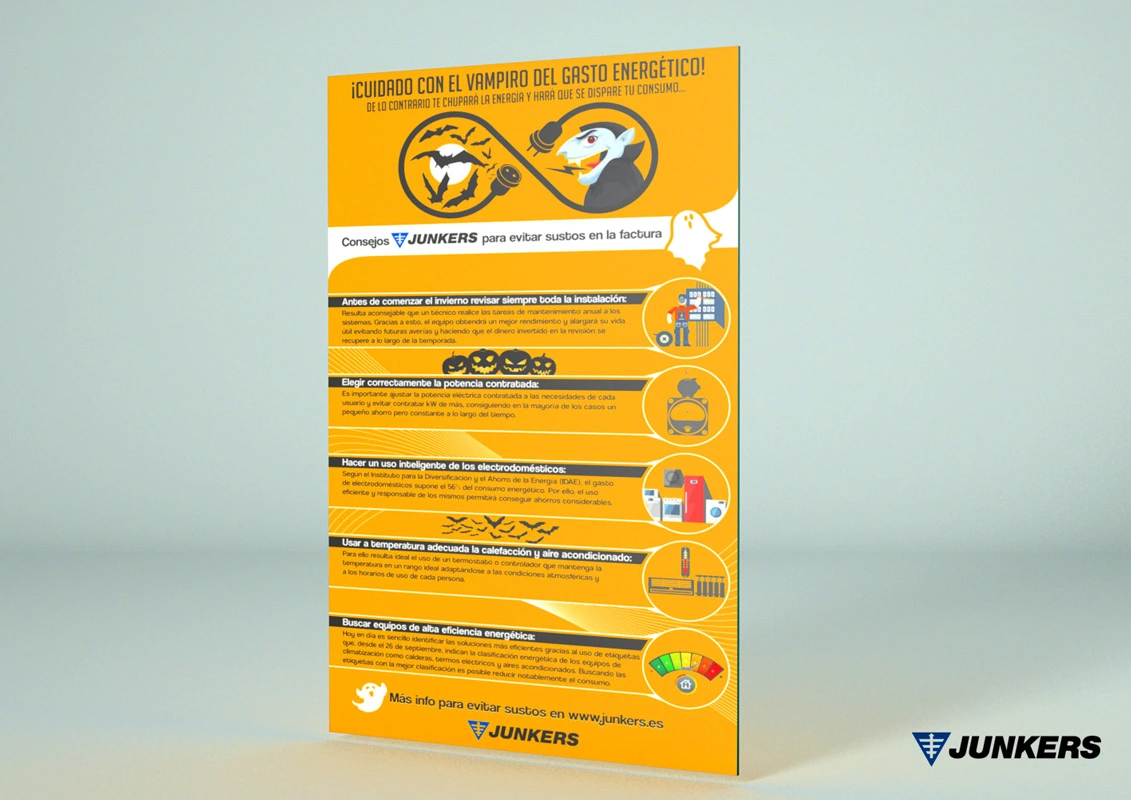
Making complexity clear in a world overwhelmed by data
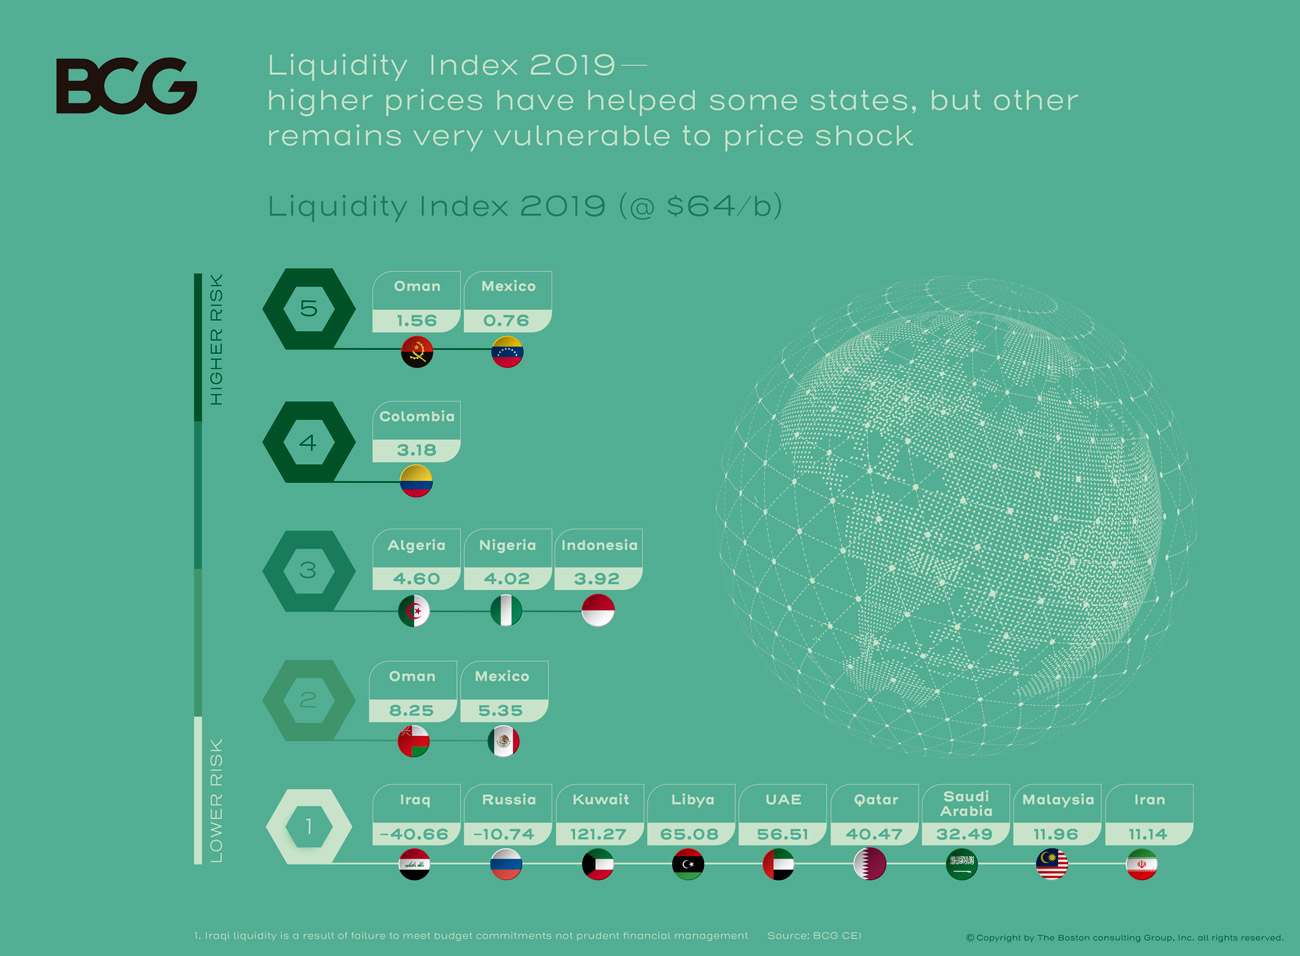
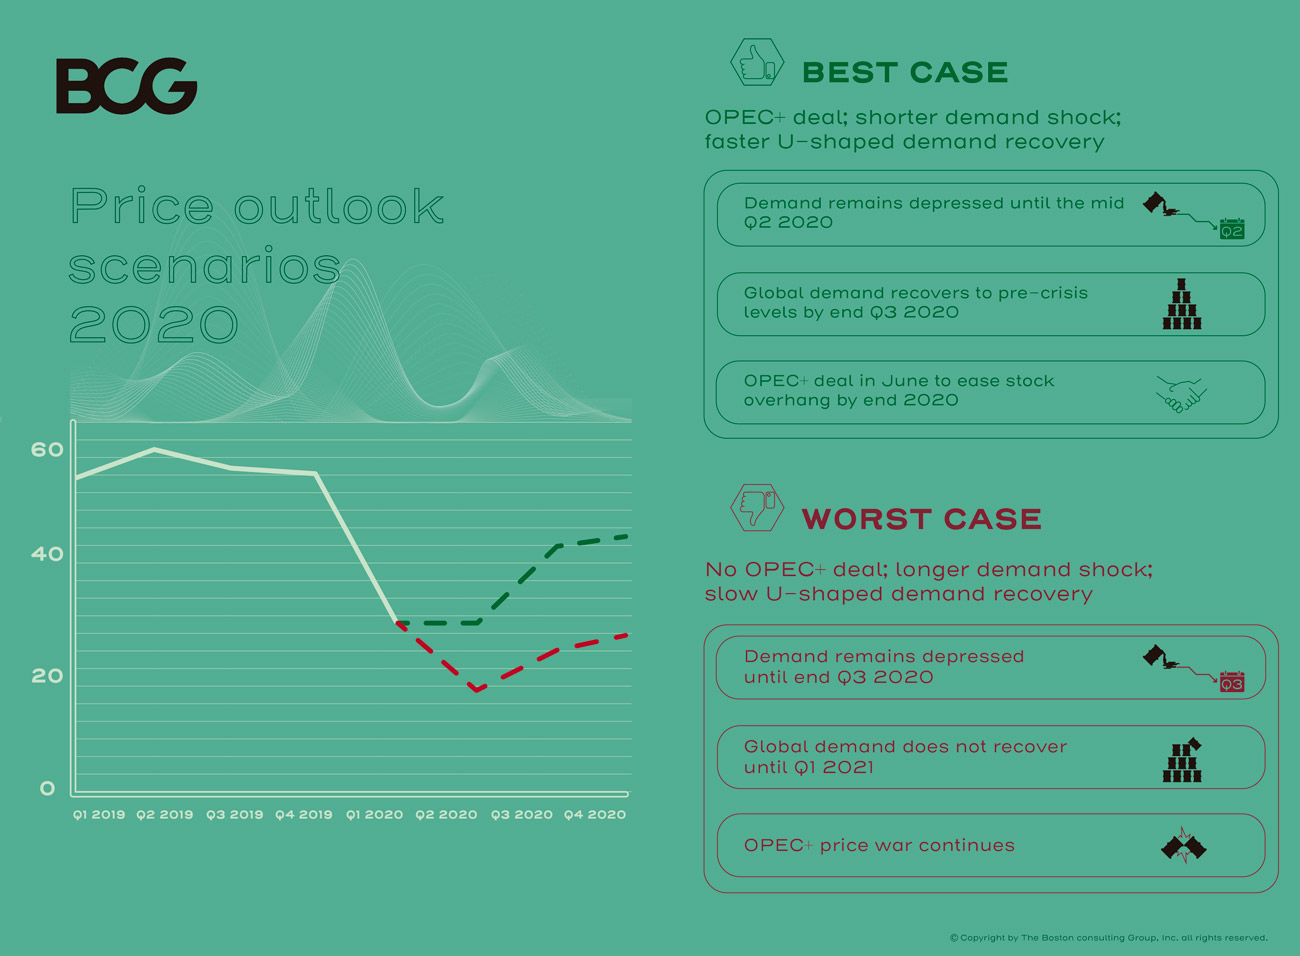
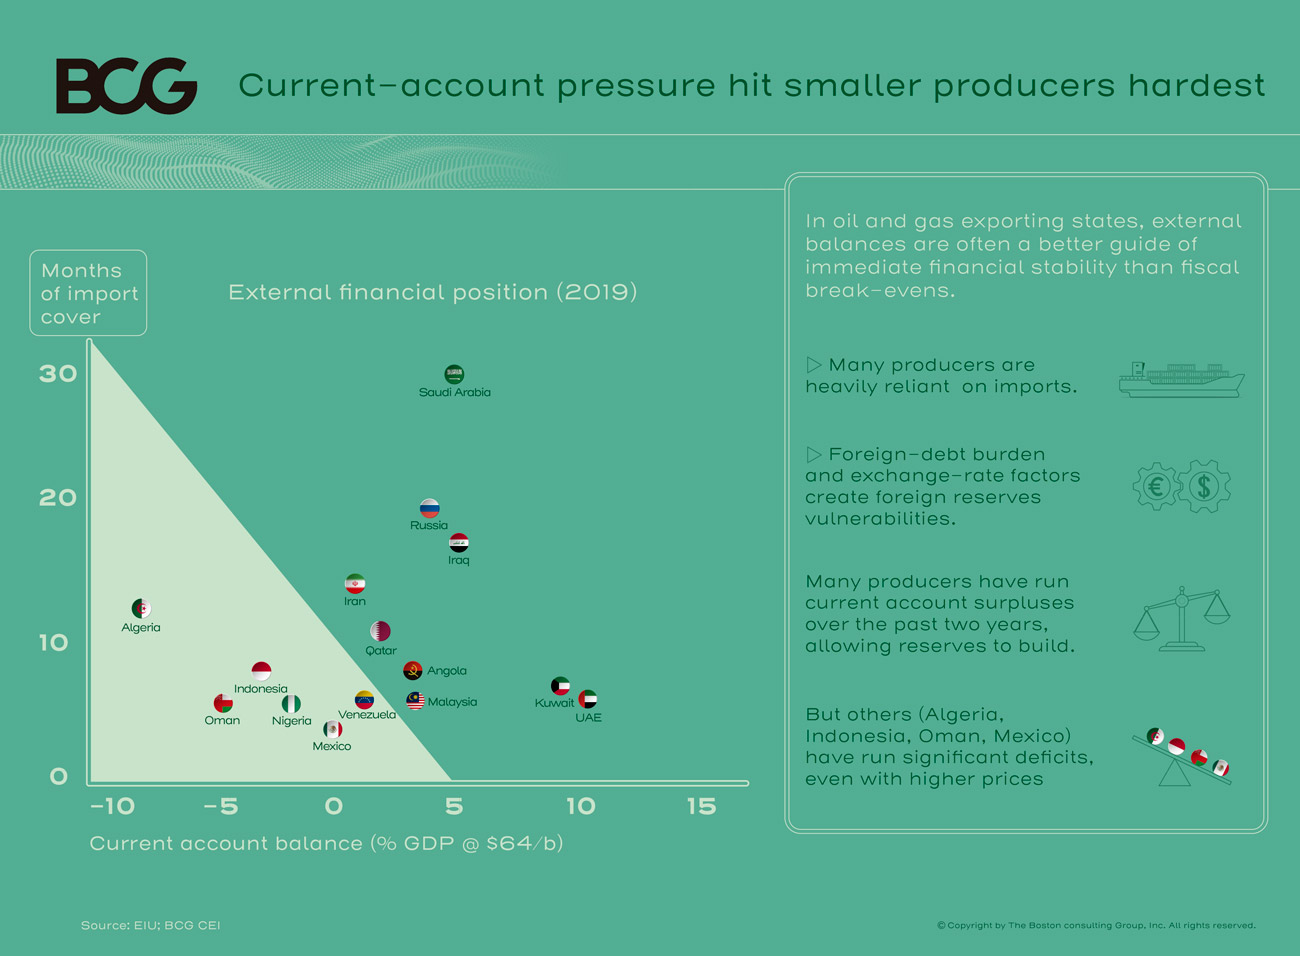
The strategic challenge of modern infographics is not simply to illustrate data, but to make knowledge easier to understand.
In an environment where attention is the scarcest asset, global brands need to transform complex datasets, technical reports and dense processes into visual narratives that are clear, engaging and, above all, actionable.
The challenge is to make information easy to absorb without compromising its technical accuracy or depth.
THE STRATEGY
Information Systems Design. Visual Synthesis & Narrative Flow.
I don’t design isolated graphics. I build information ecosystems around three strategic principles:
Cognitive Hierarchy
I apply principles of visual psychology to guide the viewer through a clear, logical path, ensuring that key messages are understood and retained immediately.
Visual Metaphors
I translate abstract concepts into visual symbols, icons and metaphors that make complex ideas more intuitive while reinforcing brand equity.
Multiformat Adaptability
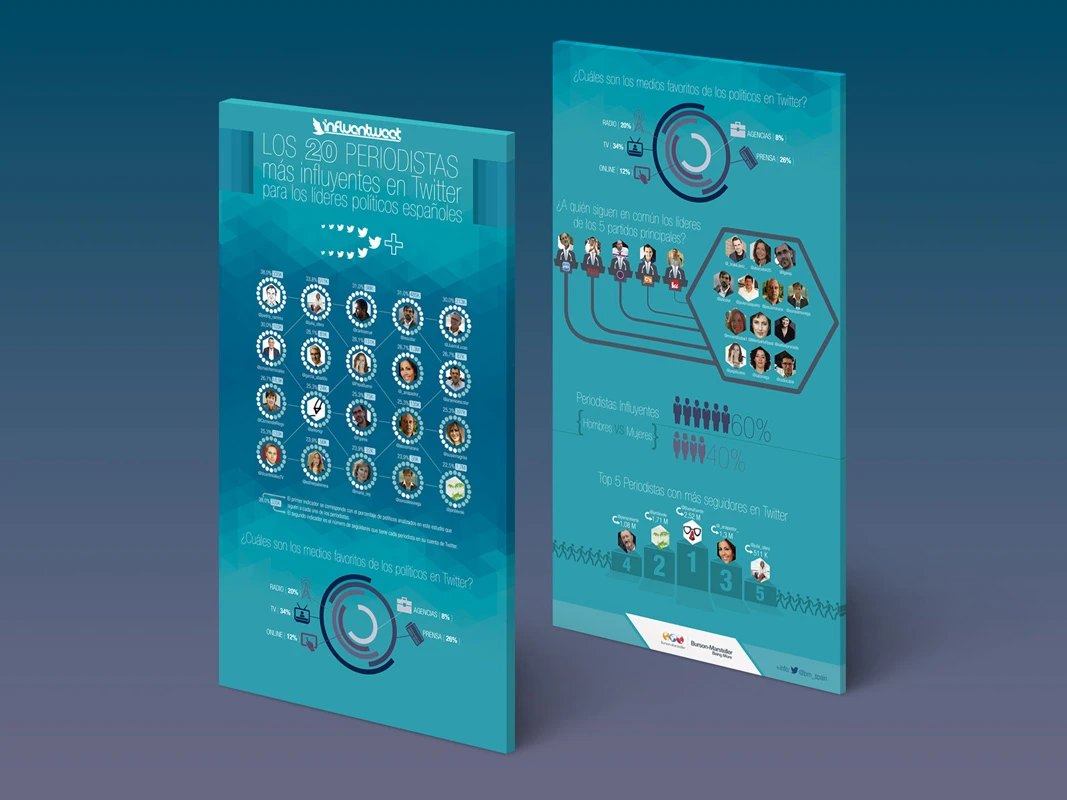
Every infographic is conceived as a flexible visual system. Its elements can be fragmented, reconfigured and adapted across different channels — from social media and executive presentations to annual reports and printed environments — while maintaining visual coherence.